
Heatmap Analytics for Websites: Because Your Users Aren’t Mind Readers
Heatmap Analytics for Websites: Because Your Users Aren’t Mind Readers
Why Heatmap Analytics for Websites Are a Game-Changer for Small Business Growth
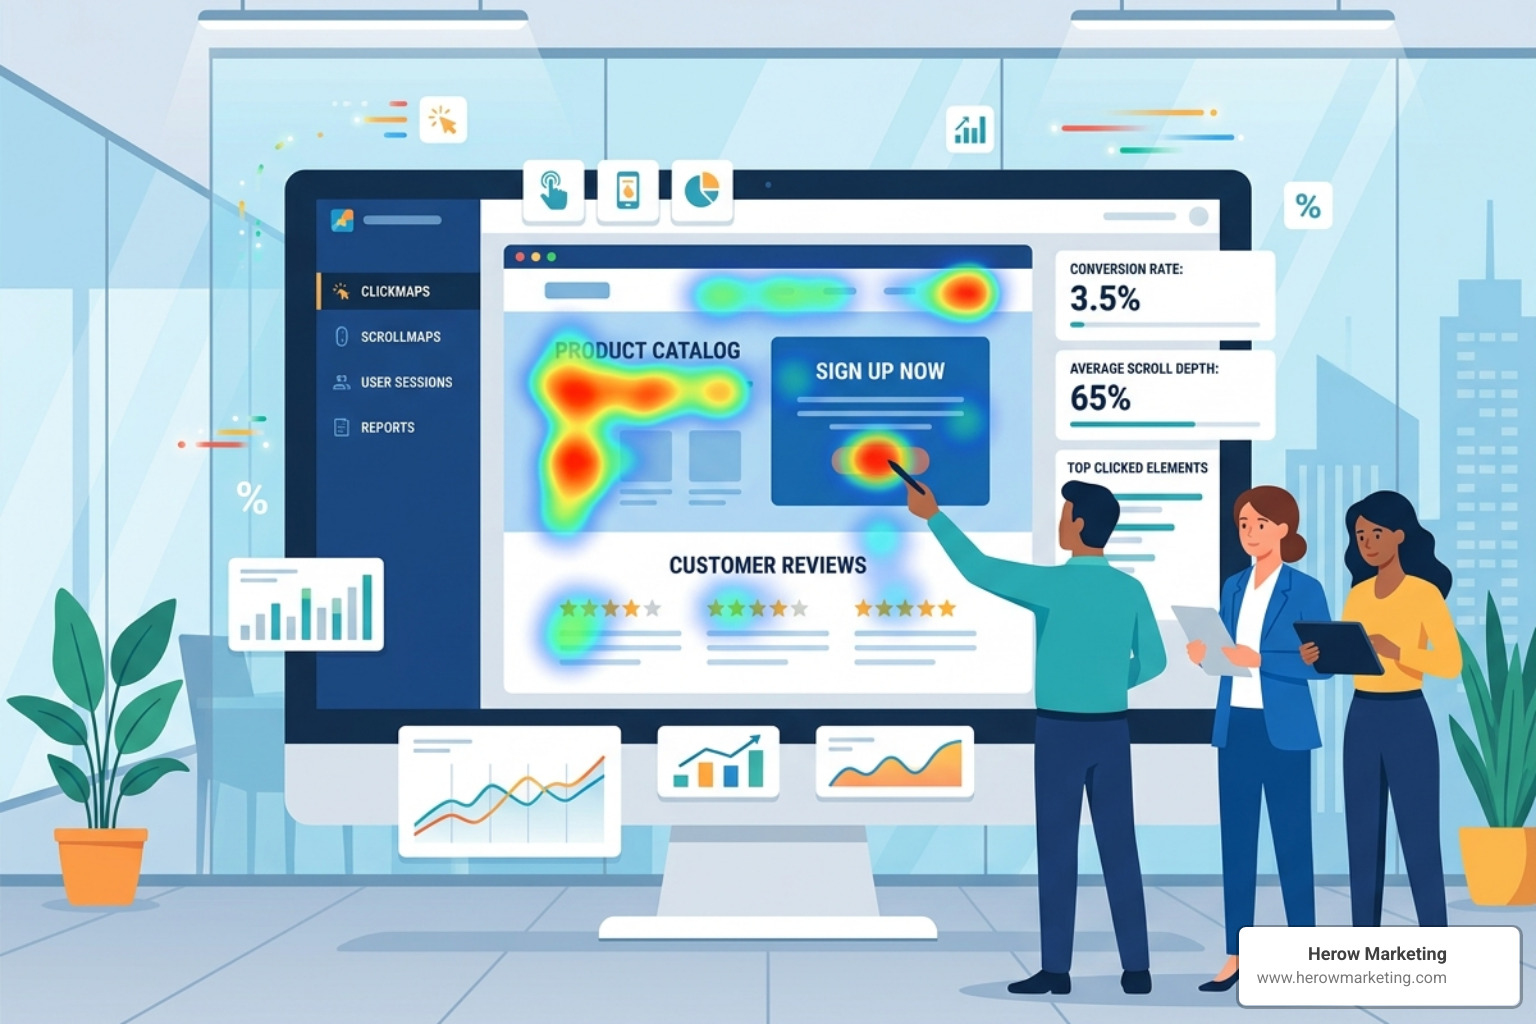
Heatmap analytics for websites show you exactly where visitors click, how far they scroll, and which parts of your pages they completely ignore — all visualized as color-coded overlays on your actual site.
Here’s a quick look at the top heatmap tools worth evaluating:
| Tool | Best For | Price |
|---|---|---|
| Microsoft Clarity | Small businesses, beginners | Free |
| Hotjar | General websites, UX teams | Free tier + paid plans |
| Heatmap.com | E-commerce, revenue tracking | Paid (free to start) |
| Amplitude | Product teams, web apps | Growth/Enterprise plans |
| website-heatmaps.com | Lightweight, open-source option | Free tier available |
Most website owners look at traffic numbers and wonder why sales aren’t following. The problem? Standard analytics tell you how many people visited — not what they did when they got there.
That gap is expensive. Users won’t tell you your call-to-action button is buried too far down the page. They’ll just leave.
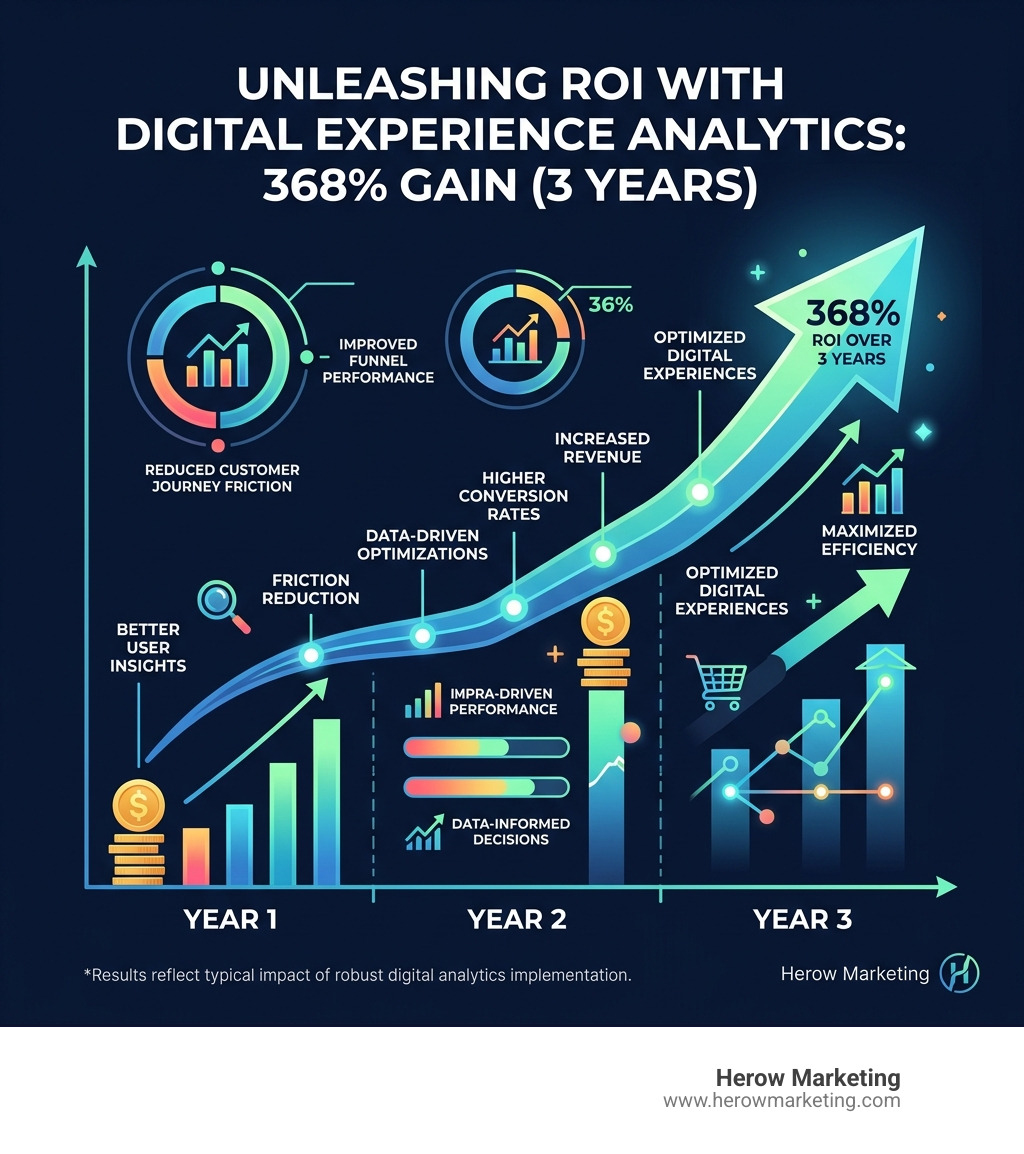
Heatmap analytics change that. They turn invisible user behavior into something you can actually see and fix. Organizations that invest in comprehensive digital experience analytics have seen an ROI of 368% over three years, according to a Forrester Total Economic Impact study — and tools like Microsoft Clarity are already being used by over 2 million sites globally.
Whether you’re losing sales on your product pages, getting low form submissions, or just not sure why visitors bounce, heatmaps give you a visual answer without needing a data science degree to understand it.
I’m Gianna Heron — with a background spanning creative direction, Wall Street finance, and digital marketing strategy, I bring a uniquely data-meets-design lens to heatmap analytics for websites that bridges the gap between what looks good and what actually converts. In this guide, I’ll walk you through the best tools on the market so you can find the right fit for your business.
Related content about heatmap analytics for websites:
Understanding Heatmap Analytics for Websites
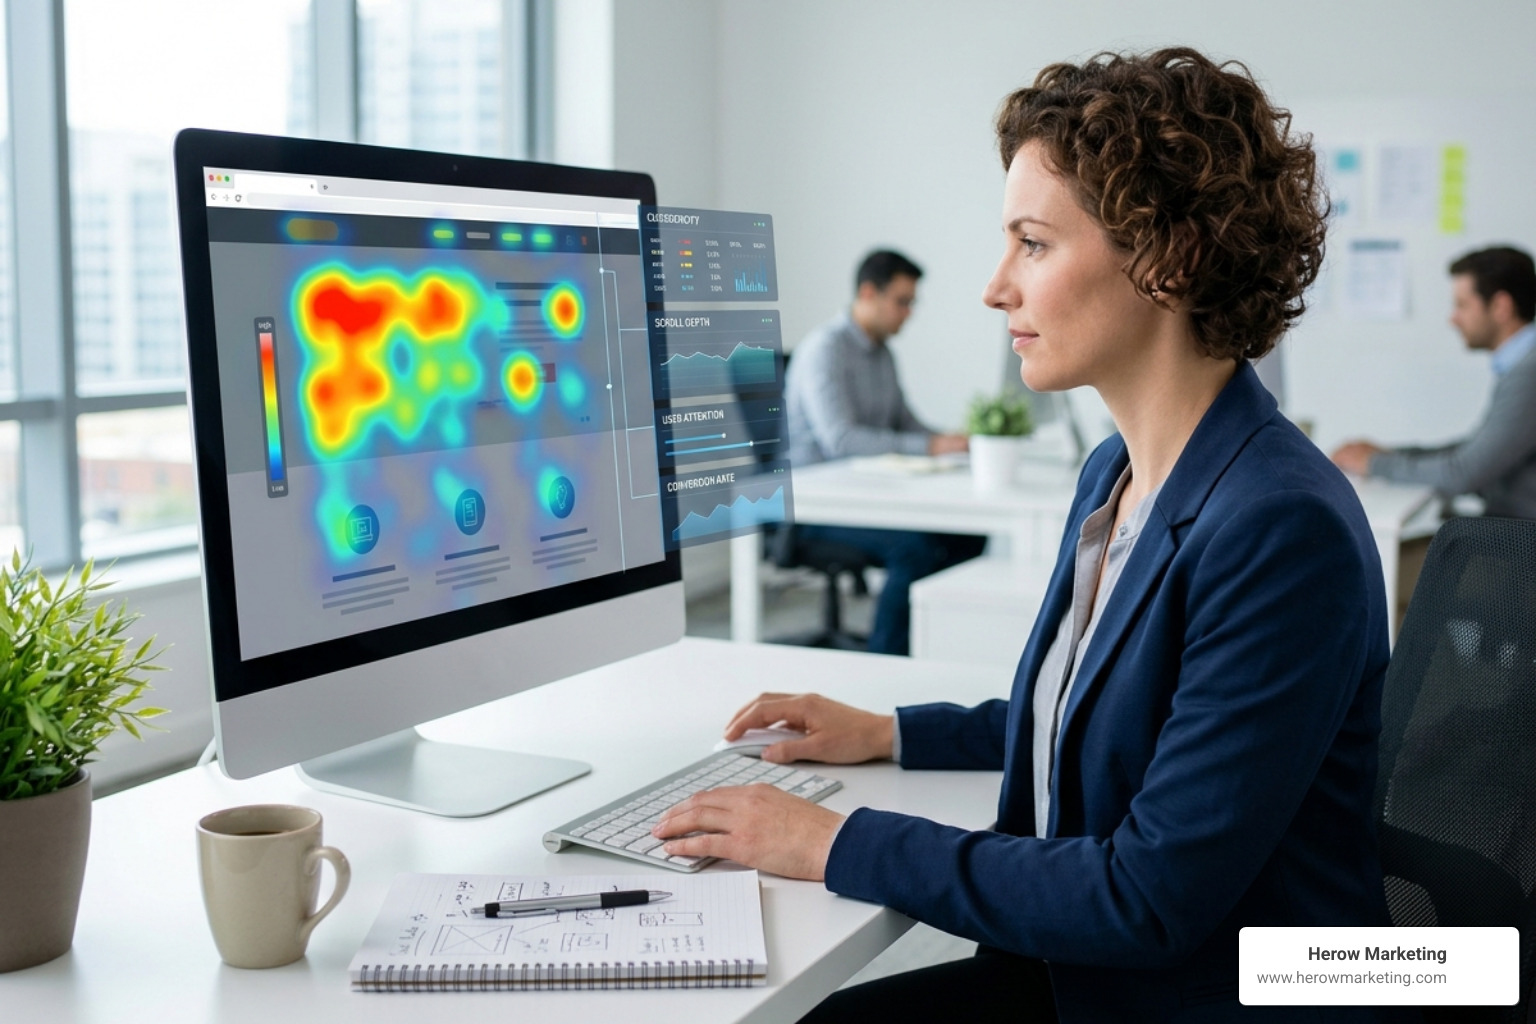
At its core, a heatmap is a visual representation of data using color to convey intensity. Think of it like a weather map, but instead of tracking rain, it tracks your customers’ attention. In 2026, we no longer have to guess what users want; we can see it.
The Mechanics of Heatmap Analytics for Websites
How does this work behind the curtain? When you install a small snippet of code—often less than 8kb—it begins tracking interactions like clicks, taps, and scrolls. This data is aggregated and displayed as a thermal overlay.
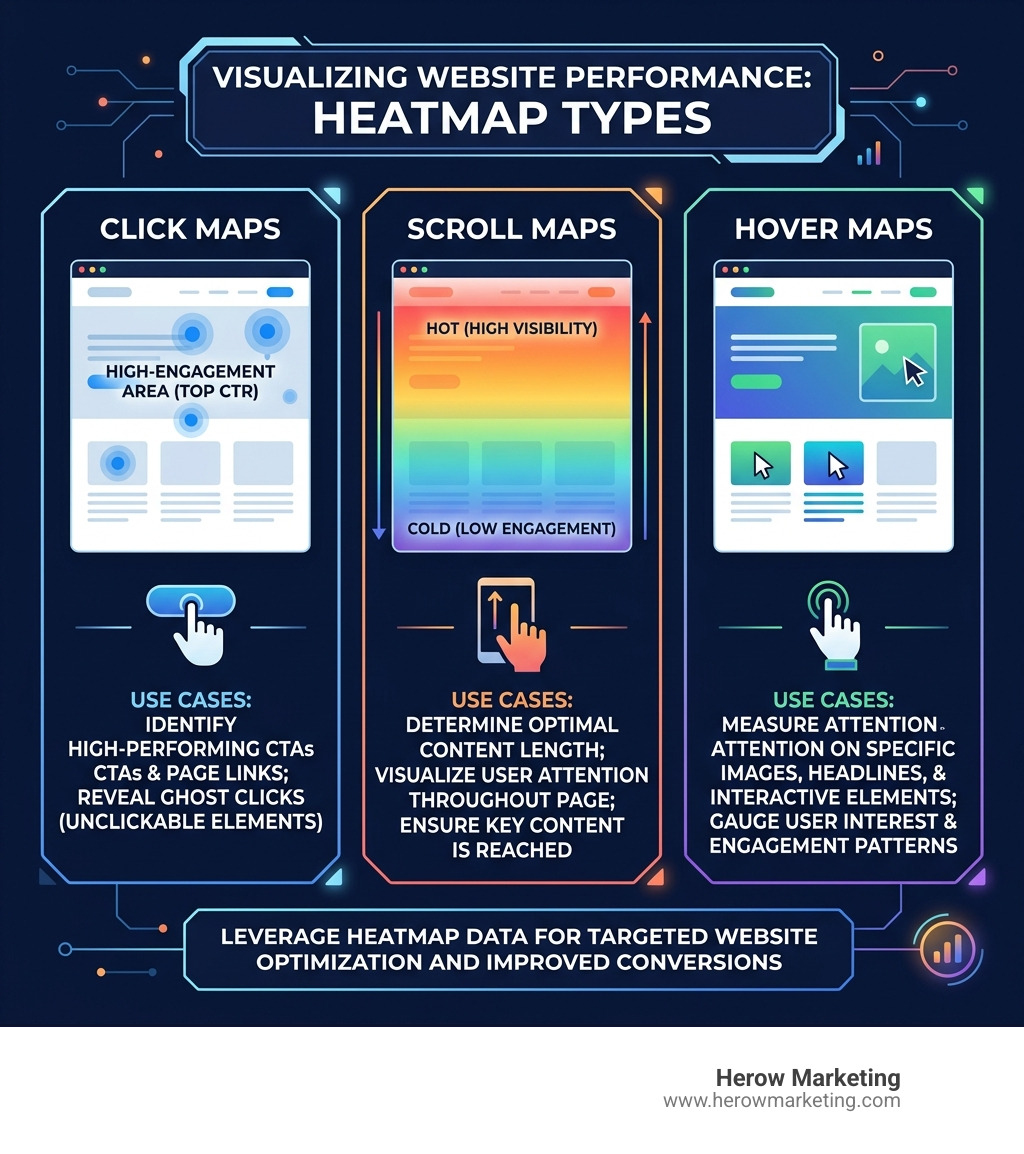
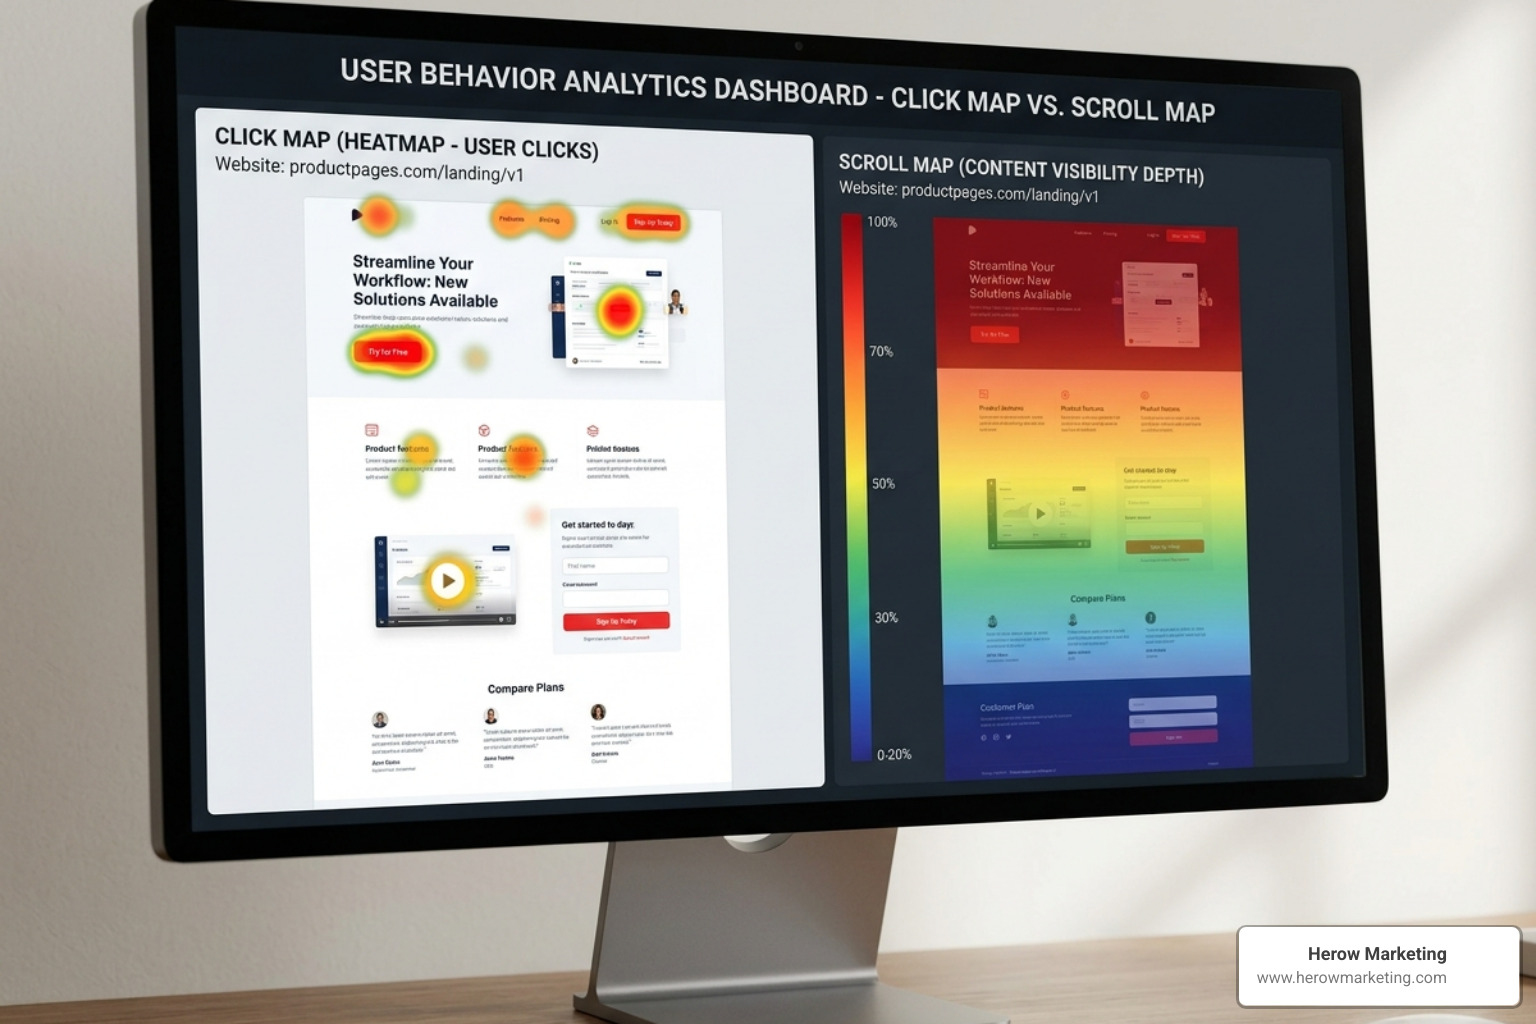
- Click Maps: These highlight the specific elements users engage with. If people are clicking on a non-linked image of a product instead of the “Add to Cart” button, you have a design distraction.
- Scroll Maps: These show you the “average fold” and where users stop scrolling. If 80% of your visitors leave before reaching your pricing table, your page is too long or the middle content isn’t engaging enough.
- Hover/Movement Maps: Interestingly, research shows a strong correlation between mouse cursor placement and eye movement. These maps reveal where users are lingering or “reading” with their mouse.
By using these tools, we can validate site structures and ensure that our Web Development efforts align with actual human behavior. It’s a visual tour de force that bridges the gap between our design intentions and the real-world user experience. Understanding this relationship is a core reason Why SEO-Driven Web Development is Your Secret Weapon—it ensures the traffic you work so hard to get actually stays on the page.
Advanced Features in Heatmap Analytics for Websites
The technology has evolved significantly by April 2026. Traditional “hot or cold” maps are now just the starting point.
- AI Insights: Platforms like Microsoft Clarity and Heatmap.com now offer AI summaries. Instead of you spending hours staring at blobs of red and blue, AI can pinpoint “Conversion Killers” or “Revenue Drivers” for you.
- Revenue Attribution: This is the holy grail for e-commerce. Tools like Heatmap.com now tie every click directly to a dollar amount. You can see that a specific image in your sidebar generated $5,000 in sales, while your main banner only drove $200.
- Selector Maps: These allow for more granular tracking of dynamic elements, like dropdown menus or pop-ups, which used to be notoriously difficult for older heatmap tools to track.
- Session Replays: Most top-tier tools bundle heatmaps with session recordings. If a heatmap shows a “rage click” (someone clicking a button ten times in frustration), you can watch the specific recording to see if the button was actually broken.
Maximizing ROI through User Behavior Insights
Data is only useful if it leads to more revenue. We’ve seen real-world examples where simple heatmap-driven changes led to massive gains. For instance, redesigning a pricing page based on scroll map data led to a 34% increase in conversions in just two weeks.
For e-commerce brands, the focus shifts to Revenue Per Session (RPS). While conversion rate is often a vanity metric, RPS tells you if your site is actually making money. One brand, Original Grain, achieved a 17% lift in RPS while scaling their traffic by 43% simply by identifying high-impact areas via element-level revenue data.
Categorizing the Best Heatmap Analytics for Websites
Choosing the right tool depends on your specific goals and business size.
- Free & Accessible: Microsoft Clarity is the undisputed king of free tools. It offers unlimited traffic, heatmaps, and session recordings for free, forever. It’s perfect for small businesses in Bethlehem or anywhere else looking to start without a monthly bill.
- The Industry Standard: Hotjar (now part of Contentsquare) is used by over 1.3 million sites. It’s incredibly intuitive and offers a great mix of heatmaps, surveys, and feedback tools.
- E-commerce Powerhouses: If you run a Shopify or WooCommerce store, Heatmap.com is built for you. It focuses on revenue attribution and includes an AI prediction engine with over 500 recommendations.
- Enterprise & Product Teams: Amplitude and Contentsquare provide deep-dive analytics for complex web apps. They allow you to segment users by their behavior, such as comparing how “power users” interact with a feature versus “new users.”
When we look at SEO, we often focus on getting people to the site. But if your user experience (UX) is poor, that traffic is wasted. Heatmaps help us ensure that the landing pages we optimize for search are also optimized for humans.
Desktop vs. Mobile Heatmap Effectiveness
| Feature | Desktop Heatmaps | Mobile Heatmaps |
|---|---|---|
| Tracking Method | Clicks and Mouse Movement | Taps, Swipes, and Zooms |
| User Intent | Often involves “hovering” while reading | Direct, high-intent taps |
| The “Fold” | Generally wider, more content visible | Narrow, requires more scrolling |
| Friction Points | Cluttered navigation, small links | “Fat finger” errors, hidden menus |
Overcoming Limitations and Privacy Hurdles
While heatmap analytics for websites are powerful, they aren’t magic. They show you what is happening, but they don’t always explain why. For example, a “cold” area on a scroll map might mean the content is boring, or it might mean the user found exactly what they needed at the top of the page and didn’t need to scroll further.
Privacy is also a major consideration in 2026. All the tools we recommend, such as Hotjar and Microsoft Clarity, are GDPR and CCPA compliant. They mask sensitive information (like credit card numbers or passwords) so that you see the behavior without compromising user identity.
Another hurdle is dynamic content. If your website has elements that shift or change (like a personalized greeting), traditional heatmaps can sometimes get “blurry.” This is where advanced tools like Amplitude’s selector maps come in, as they track the underlying code element rather than just the pixel location.
Finally, remember to Clean Up Your Link Profile Before Google Does It For You. Just as bad links can hurt your SEO, bad site navigation revealed by heatmaps can hurt your user trust.
Frequently Asked Questions about Heatmap Analytics
How long does it take to see meaningful data?
It depends on your traffic. For a statistically significant sample, we usually recommend waiting until you have at least 2,000 to 5,000 sessions on a specific page. For a high-traffic site, this could take a few days; for a local Bethlehem business, it might take a month.
What do different colors indicate on a heatmap?
Heatmaps use a “thermal” scale. Red and orange (Hot) indicate high engagement—this is where the action is. Blue and green (Cold) indicate low engagement. If your primary “Buy Now” button is sitting in a blue zone, you have a major conversion problem.
Can heatmaps track mobile app users?
Most standard web heatmap tools focus on mobile web (browsers like Safari or Chrome on a phone). However, enterprise tools like Microsoft Clarity and Amplitude offer SDKs (Software Development Kits) that allow you to track interactions within native iOS and Android apps as well.
Conclusion
At Herow Marketing, we believe that “guessing isn’t a growth strategy.” Whether you are looking for a free tool to get started or a revenue-attributed powerhouse to scale your e-commerce store, heatmap analytics for websites provide the transparency you need to make smart decisions.
Our strategic playbook is built on this kind of data transparency. We don’t just tell you your site looks good; we show you the monthly reports that prove it’s driving measurable growth. If you’re tired of “data layer nightmares” and want to see what your users are actually doing, it’s time to move beyond standard traffic reports.
Don’t settle for a marketing strategy that leaves you in the dark. Whether you’re investigating why your SEO Services: Why Your $250 Monthly Budget is Buying You Nothing or you’re ready to Transform your digital strategy with Herow Marketing, we are here to help you turn those “cold zones” into conversion hotspots.